

Using a Conversational Chat Interface to Analyse Business KPIs
Learn how a conversational chat interface and causal chain analysis help you run investigative analysis on business KPIs without a data team.
A
Anonymous
Oct 26, 2026 · 10 min read
Using a Conversational Chat Interface to Analyse Business KPIs
Business leaders can now analyze complex KPIs without a data team by using a conversational chat interface to run natural language queries directly against their databases. This approach replaces manual Excel variance decks with near real-time, AI driven insights.
By connecting tools like FireAI directly to your existing ERP, CRM, or Tally systems, non-technical managers can perform investigative analysis, run a heterogenous drilldown across messy datasets, and trace root causes using causal chain analysis. This guide outlines the exact framework to transition from slow, analyst-dependent reporting to on-demand decision-making in days, not weeks.
The Hidden Cost of the Traditional BI Reporting Queue
For many growing Indian businesses, daily operations move faster than daily reporting. When a regional manager wants to know why sales dropped in a specific district, they must wait for the data team. By the time the variance report arrives, the business quarter is already over.
Relying on manual reporting cycles creates significant operational leakage. Managers spend 10 to 15 hours per week manually compiling data from Tally, spreadsheets, and distributor management systems. During this lag, critical issues like representative underperformance, stockouts, and route distortion go unnoticed. (Source: FireAI customer data, Q1 2026).
When data is delayed, businesses cannot react to shifting market conditions. For example, a distributor might reduce their order volume because of a competitor's promotion. If this drop only surfaces during the month-end review, the company loses four weeks of corrective sales action. (Source: FireAI customer data, Q1 2026).
According to Gartner, decision intelligence platforms support and augment human decisions by combining data, analytics, and AI. (Source: Gartner, 2026). Waiting for a central data team to build static dashboards is no longer a viable strategy. Businesses require immediate answers to operational questions to protect their margins.
Querying Databases via a Conversational Chat Interface
A conversational chat interface allows business leaders to query databases using natural language. Instead of writing complex SQL queries, you type or speak your question as if talking to an analyst. The underlying engine translates your query into precise database commands, retrieves the data, and formats the output.
This interface supports 90 text languages and 20+ voice languages, allowing regional managers to query data in their preferred language. For example, a user can ask, "Show me our top-performing outlets in Maharashtra this week," and receive a sorted table instantly. This democratizes data access across the entire organization.
The interface does not expose your database to external risks. It operates as a translation layer, converting user queries into SQL commands that run within your secure environment. This architecture ensures that sensitive financial data is only accessible to authorized users based on role-based access controls. (Source: FireAI security documentation, 2026).
Generic tools like ChatGPT are often limited to one-shot answers and lack context about your database structure. In contrast, a specialized conversational chat interface connects directly to your live data sources and maintains operational context. You can read a detailed comparison of these approaches at /comparisons/chatgpt.
Conducting Investigative Analysis on Messy Business Data
Static dashboards often hide critical operational details behind high-level averages. To find the true drivers of performance, managers must conduct investigative analysis. This process involves digging into outliers, anomalies, and specific transaction paths rather than accepting aggregated figures.
Traditional business intelligence systems require clean, structured data warehouses to function. However, real-world field data from regional sales routes is often messy, containing missing GPS pings, retroactive entries, or incomplete call reports. Modern investigative analysis tools are built to tolerate these noisy inputs.
During peak sales seasons, high-level metrics can look positive while underlying routes are failing. A regional manager might see overall target achievement but miss that 20% of their outlets are experiencing stockouts. Investigative analysis exposes these hidden gaps before they impact the overall quarterly bottom line.
By applying AI driven insights to messy operational data, the system can automatically flag anomalies. It filters out the noise to highlight genuine patterns, such as a sudden drop in distributor orders or an unexpected delay in delivery times. If you want to check your current metrics manually, you can use our free FMCG Beat Productivity Calculator to audit field performance.
A Worked Example: Tracing a ₹45 Lakh Revenue Drop
Consider a consumer goods company experiencing a sudden revenue drop in West Bengal. Instead of waiting for the weekly sales meeting, the Head of Sales opens the conversational chat interface and types: "What was our sales variance in West Bengal this month?"
The system returns a chart showing a ₹45 lakh deficit compared to the previous month. The manager then initiates a heterogenous drilldown by asking: "Which distributors in West Bengal had the largest drop in orders?"
The system identifies three specific distributors in Siliguri. Through causal chain analysis, the system links this drop to a 4-day delay in shipping from the Kolkata warehouse, which caused localized stockouts. The manager contacts the logistics lead immediately, resolving the bottleneck in minutes rather than waiting for month-end reports.
Breaking Down Data Silos with Heterogenous Drilldown
Traditional reporting tools limit your analysis to a single database or pre-defined data model. If you start with a financial metric from Tally, you cannot easily drill down into logistics or sales force automation data. A heterogenous drilldown solves this by allowing users to cross database boundaries in a single analytical path.
This capability means you can click on a high-level revenue outlier and immediately view the underlying operational data. For example, you can trace a dip in invoice value down to specific delivery routes, individual sales representatives, or product SKUs. The system maps these relationships automatically without requiring a unified data warehouse.
The table below illustrates how a heterogenous drilldown connects different business systems to trace a single metric anomaly:
| Step | Metric Analyzed | Source System | Analytical Action |
|---|---|---|---|
| 1 | Outstanding Balance | Tally ERP | Identify top 5 overdue distributor accounts |
| 2 | Beat Productivity | Sales Force Automation (SFA) | Check recent visit frequency for those accounts |
| 3 | Inventory Status | Warehouse Management (WMS) | Verify if stockouts caused the payment delays |
| 4 | Order Status | Shopify / POS | Review real-time consumer demand for the missing SKUs |
Through this multi-system path, managers can execute comprehensive ai driven analysis. They no longer need to export multiple CSV files and perform manual VLOOKUP operations in Excel. The system handles the cross-database mapping behind the scenes.
Causal Chain Analysis: Finding the Why Behind the What
Most business intelligence tools show you what happened, such as a 12% drop in gross margin. However, knowing what happened is only half the battle. To take effective action, you must understand the underlying causes of that movement.
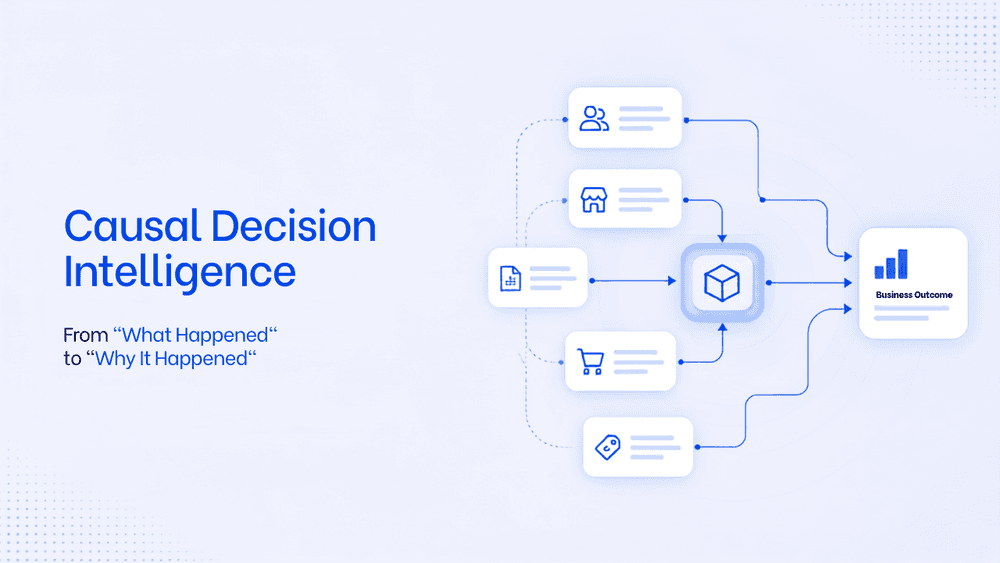
This is where causal chain analysis becomes essential. It maps the cause-and-effect relationships between different operational variables. The system builds an interactive graph that connects high-level KPIs to their real-world drivers.
Correlation simply shows that two metrics moved at the same time, such as an increase in marketing spend and a rise in sales. However, causal chain analysis determines if the marketing spend actually drove those sales or if a seasonal discount was the true cause. Distinguishing between these factors prevents companies from misallocating their budgets based on misleading trends.
For example, a drop in gross margin might trace back to an increase in procurement costs for a specific raw material. The causal chain analysis then links that cost increase to a supplier delay, which forced a shift to a more expensive local vendor. By presenting these links clearly, the system delivers actionable ai driven insights rather than simple data summaries.
A Three-Step Framework for AI Driven Analysis
Implementing an advanced decision intelligence system does not require a multi-month engineering project. You can establish an operational flow that bypasses the data team queue entirely. This framework allows non-technical business leaders to run their own analyses in three simple steps.
Step 1: Connect Your Data Sources
First, connect your existing business systems directly to the analytics layer. Platforms like FireAI offer 700+ connectors to tools like Tally, Zoho CRM, and Shopify without requiring data migration. This setup delivers your first dashboard within days, with secure data handling backed by ISO 27001:2022 certification (details at /security).
Step 2: Ask Questions in Plain Language
Once connected, users can query their data using a conversational chat interface. You can type or speak questions in 90 text languages and 20+ voice languages. The system translates these queries instantly, bypassing the need for SQL knowledge or custom report requests. This allows regional managers to query data directly from the field.
Users do not need to learn specific prompt engineering tricks. The natural language processing engine understands regional vocabulary, business abbreviations, and conversational follow-up questions. For instance, after asking for top outlets, you can simply type 'which of these had the lowest margins?' to narrow your search.
Step 3: Act on Causal Insights
Finally, use causal chain analysis to evaluate the suggested root causes. The system automatically highlights anomalies and traces the operational path that led to the metric change. This approach shortens the time from question to decision.
Real-World Business Outcomes: Daffoworth Pharma and GSN Group
Transitioning to self-serve analytics has delivered measurable efficiency gains for growing Indian enterprises. By replacing manual reporting queues with automated decision intelligence, companies have reduced their reporting lag from weeks to minutes.
For example, Daffoworth Pharmaceutical Pvt Ltd. adopted this approach to streamline their operational metrics. "FireAI Analytics has transformed data analysis at Daffoworth Pharma, turning hours of reporting into minutes. Simple, fast, and highly effective for decision-making." (Source: Daffoworth Pharmaceutical Pvt Ltd. customer story).
Similarly, GSN Group utilized direct integrations to eliminate data silos. "FireAI's Tally integration enables faster reports and real-time insights, making decisions effortless for growing businesses." (Source: GSN Group customer story). Across these organizations, the transition has cut report preparation time and sped up decisions.
According to McKinsey, data-driven organizations are significantly more likely to acquire and retain customers. (Source: McKinsey, 2022). Removing the reporting queue allows companies to capture this value without hiring expensive specialized talent.
Choosing Your Analytics Layer: FireAI vs. Traditional BI vs. Basic Chatbots
Selecting the right analytical system depends on your team's technical capabilities and the complexity of your data. Traditional business intelligence tools require specialized training, while basic chatbot wrappers often lack the depth needed for complex business logic.
The table below compares these approaches across key operational criteria:
| Feature | Legacy BI (Power BI / Tableau) | Basic Chatbot Wrappers | FireAI Causal Decision Intelligence |
|---|---|---|---|
| Setup Time | 6–16 weeks | Hours (unstructured) | Days |
| Query Interface | Drag-and-drop / DAX | Conversational chat interface | Conversational chat interface (90 languages) |
| Root Cause Analysis | Manual filtering | None | Automated causal chain analysis |
| Drilldown Capability | Single-schema only | None | Heterogenous drilldown across systems |
| Messy Data Tolerance | Low (requires clean warehouse) | Low (leads to hallucination) | High (sits above noisy field data) |
| Connectors | Manual ETL build required | API wrappers only | 700+ native connectors |
Traditional BI remains useful for static, highly structured corporate dashboards that rarely change. However, for operational leaders who need to make daily decisions, a system that combines a conversational chat interface with causal chain analysis provides a faster path to clarity.
Take Control of Your Operational Decisions
Waiting for a data team to build reports is an unnecessary bottleneck for growing businesses. By adopting a conversational chat interface, operational managers can run their own investigative analysis and identify the root causes of metric shifts instantly. This shift saves hours of manual compilation and prevents costly operational leakage.
To see how decision intelligence can transform your business reporting, you can begin exploring your data today. FireAI offers a free tier with no credit card required, allowing you to connect your first data sources and receive insights within days. You can view the full details of our pricing tiers at fireai.in/pricing.
FAQ
A conversational chat interface translates natural language queries into precise database queries under the hood. Users do not need to know database structures, table schemas, or SQL syntax. You simply ask a question in plain English, Hindi, or any of 90 languages, and the interface returns formatted tables and charts instantly.
Causal chain analysis is a method that maps cause-and-effect relationships between business metrics. When a high-level KPI like gross margin drops, causal chain analysis traces the movement down to underlying drivers. It isolates variables such as localized distributor stockouts, regional sales representative performance, or supply chain delays.
A heterogenous drilldown allows a user to click through a metric from one data source and drill directly into a completely different schema or system. For example, you can drill from a Tally invoice amount down to a specific SFA beat route or GPS ping. This works even when field data is messy, retroactive, or missing coordinates.
Yes. Modern decision intelligence systems sit directly above your existing systems like Tally, Shopify, and Zoho CRM. They read the data directly through native API connectors without requiring you to build a custom ETL pipeline, establish a data warehouse, or hire a dedicated engineering team.
With pre-built connectors and an AI-driven setup, businesses can see their first useful dashboard within 1–2 weeks. Fully tuned models that map complex, custom data structures are typically ready within 4–6 weeks. This is significantly faster than traditional BI setups which usually require 6–16 weeks.
Keep reading
More from the blog
See FireAI on your data.
Book a walkthrough to see how FireAI turns your business data into AI-driven decisions.