Blog
Stay updated with the latest insights, trends, and innovations in AI and business intelligence.
What's New?
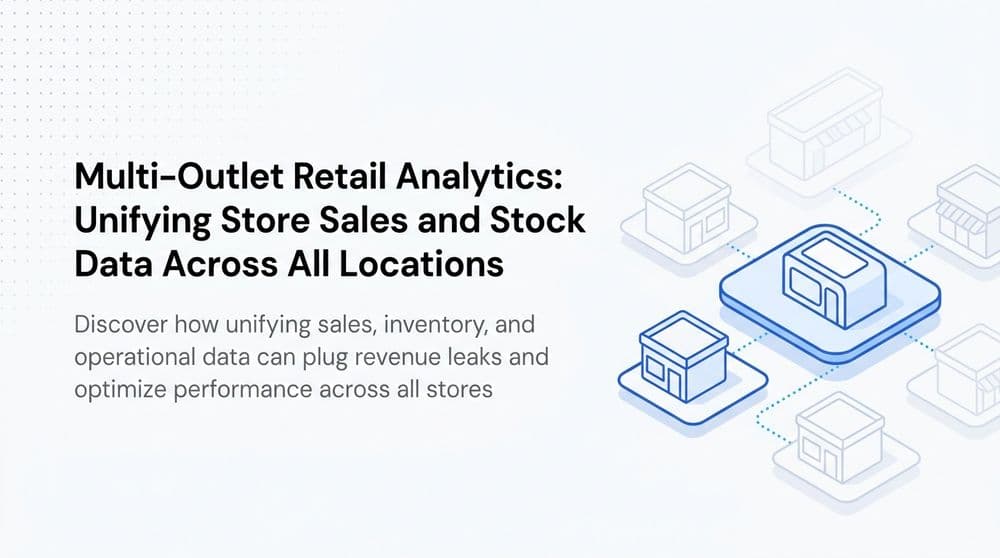
Multi-Outlet Retail Analytics: Track Store Sales
Track sales, stockouts, and staff performance across all stores. Learn how multi-outlet retail analytics can find the root cause of revenue leaks.
S.P. Piyush Krishna
Content Writer, Fire AI
Jul 5, 20267 min read
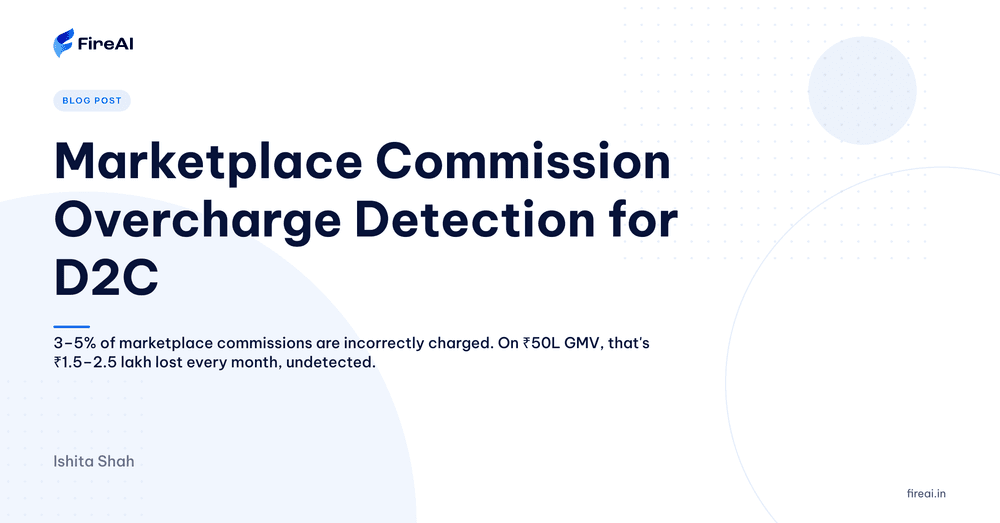
Marketplace Commission Overcharge Detection: A D2C Playbook
Indian D2C brands lose 2-3% of GMV to marketplace fee errors. Here's how to detect Amazon, Flipkart and quick-commerce overcharges in time to file claims.
Ishita Shah
Content Editor, FireAI
May 28, 202612 min read
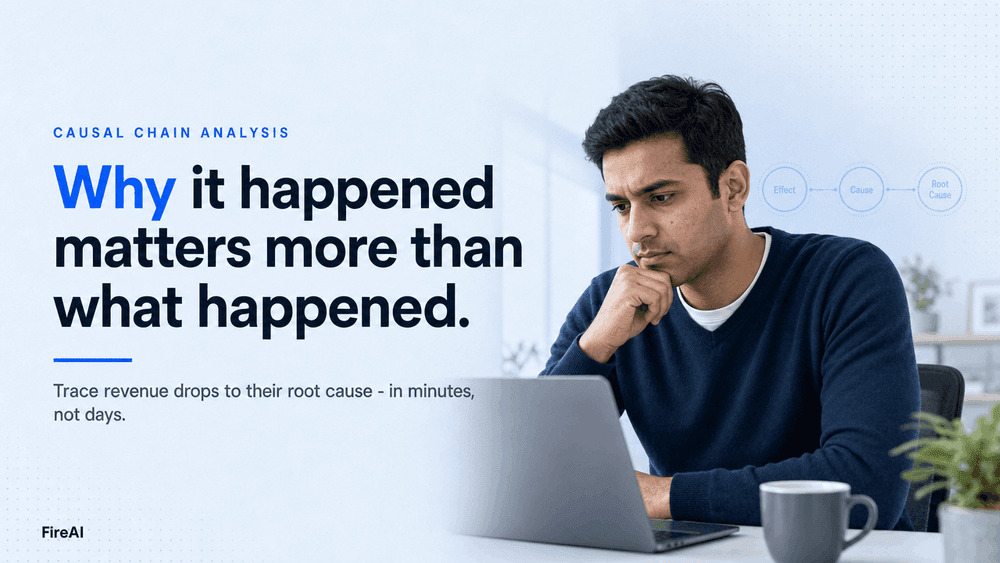
Causal Chain Analysis: Fix What's Breaking Revenue
Causal chain analysis traces metric drops to their root cause. Learn how Indian businesses use it to stop revenue leaks before they compound.
S.P. Piyush Krishna
Content Writer, Fire AI
May 27, 20268 min read
All Blogs
Analytics
Multi-Outlet Retail Analytics: Track Store Sales
Track sales, stockouts, and staff performance across all stores. Learn how multi-outlet retail analytics can find the root cause of revenue leaks.
S.P. Piyush Krishna
Content Writer, Fire AI
Jul 5, 20267 min read
Analytics
Marketplace Commission Overcharge Detection: A D2C Playbook
Indian D2C brands lose 2-3% of GMV to marketplace fee errors. Here's how to detect Amazon, Flipkart and quick-commerce overcharges in time to file claims.
Ishita Shah
Content Editor, FireAI
May 28, 202612 min read
Analytics
Causal Chain Analysis: Fix What's Breaking Revenue
Causal chain analysis traces metric drops to their root cause. Learn how Indian businesses use it to stop revenue leaks before they compound.
S.P. Piyush Krishna
Content Writer, Fire AI
May 27, 20268 min read
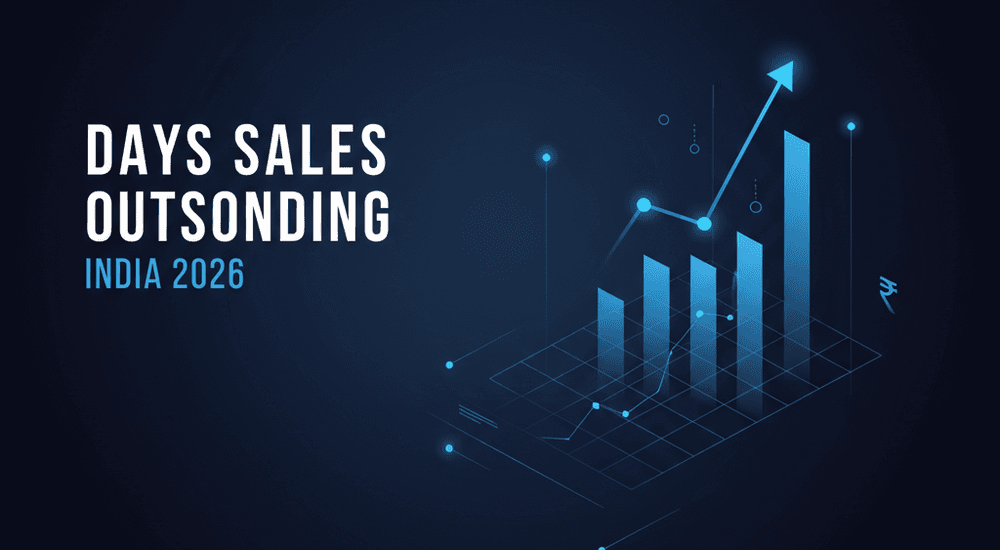
Days Sales Outstanding (DSO): The Indian B2B Operator's Ultimate Guide
Days Sales Outstanding (DSO) explained for Indian B2B and FMCG teams: the formula, 2026 benchmarks, and what AI analytics surfaces beyond a single number.
S.P. Piyush Krishna
Content Writer, Fire AI
May 24, 20269 min read
Analytics
CFO’s AI Analytics Guide 2026: From Monthly Close to Real Time
A working CFO AI analytics guide: replace the monthly close lag with real-time financial analytics, AI FP&A automation, and a CFO dashboard that decides.
Ishita Shah
Content Editor, FireAI
May 16, 202612 min read
Analytics
Outlet-Wise P&L for Restaurants: A 2026 Operator's Playbook
Your chain did ₹12 crore in revenue last year. The P&L says you're profitable. But which outlets are profitable — and which are being quietly subsidised by the ones that work? If you can't answer that by location, you're flying blind.
Ishita Shah
Content Editor, FireAI
May 14, 202614 min read

Analytics
White Space Analysis for FMCG: Finding Untapped Markets with AI
Most FMCG sales leaders assume their coverage gaps are known. They're not — they're estimated. Based on distributor claims, field rep feedback, and the occasional market visit. The outlets you aren't reaching don't appear in your Tally data. The SKUs your distributors aren't pushing don't show up on beat reports. What's missing is, by definition, invisible. That invisibility is expensive.
Ishita Shah
Content Editor, FireAI
May 9, 20267 min read

Data
Tally Analytics Dashboards for Indian Businesses
80% of Indian SMBs use Tally. Fewer than 5% have dashboards. Learn how to build real-time P&L, cash flow, and receivables analytics from your Tally Prime data.
Ishita Shah
Content Editor, FireAI
May 7, 20269 min read

Analytics
Secondary Sales Tracking: From Excel Chaos to Real-Time Outlet Intelligence
You have primary billing data. You have distributor stock reports. What you don't have is a clear, current picture of what's actually selling at the outlet level — and that gap is costing you more than you think.
Ishita Shah
Content Editor, FireAI
May 6, 20266 min read

Analytics
Closing the Data Decision-Making Gap in Indian Business
Learn how the data decision-making gap stalls growth in Indian enterprises and how causal decision intelligence bridges the analytics gap for teams.
Souryojit Ghosh
Content Editors, Fire AI
Jul 11, 20265 min read
Analytics
Multi-Outlet Retail Analytics: Track Store Sales
Track sales, stockouts, and staff performance across all stores. Learn how multi-outlet retail analytics can find the root cause of revenue leaks.
S.P. Piyush Krishna
Content Writer, Fire AI
Jul 5, 20267 min read
Analytics
Marketplace Commission Overcharge Detection: A D2C Playbook
Indian D2C brands lose 2-3% of GMV to marketplace fee errors. Here's how to detect Amazon, Flipkart and quick-commerce overcharges in time to file claims.
Ishita Shah
Content Editor, FireAI
May 28, 202612 min read
Analytics
Causal Chain Analysis: Fix What's Breaking Revenue
Causal chain analysis traces metric drops to their root cause. Learn how Indian businesses use it to stop revenue leaks before they compound.
S.P. Piyush Krishna
Content Writer, Fire AI
May 27, 20268 min read
Days Sales Outstanding (DSO): The Indian B2B Operator's Ultimate Guide
Days Sales Outstanding (DSO) explained for Indian B2B and FMCG teams: the formula, 2026 benchmarks, and what AI analytics surfaces beyond a single number.
S.P. Piyush Krishna
Content Writer, Fire AI
May 24, 20269 min read
Analytics
CFO’s AI Analytics Guide 2026: From Monthly Close to Real Time
A working CFO AI analytics guide: replace the monthly close lag with real-time financial analytics, AI FP&A automation, and a CFO dashboard that decides.
Ishita Shah
Content Editor, FireAI
May 16, 202612 min read
Analytics
Outlet-Wise P&L for Restaurants: A 2026 Operator's Playbook
Your chain did ₹12 crore in revenue last year. The P&L says you're profitable. But which outlets are profitable — and which are being quietly subsidised by the ones that work? If you can't answer that by location, you're flying blind.
Ishita Shah
Content Editor, FireAI
May 14, 202614 min read
Analytics
White Space Analysis for FMCG: Finding Untapped Markets with AI
Most FMCG sales leaders assume their coverage gaps are known. They're not — they're estimated. Based on distributor claims, field rep feedback, and the occasional market visit. The outlets you aren't reaching don't appear in your Tally data. The SKUs your distributors aren't pushing don't show up on beat reports. What's missing is, by definition, invisible. That invisibility is expensive.
Ishita Shah
Content Editor, FireAI
May 9, 20267 min read
Data
Tally Analytics Dashboards for Indian Businesses
80% of Indian SMBs use Tally. Fewer than 5% have dashboards. Learn how to build real-time P&L, cash flow, and receivables analytics from your Tally Prime data.
Ishita Shah
Content Editor, FireAI
May 7, 20269 min read
Analytics
Secondary Sales Tracking: From Excel Chaos to Real-Time Outlet Intelligence
You have primary billing data. You have distributor stock reports. What you don't have is a clear, current picture of what's actually selling at the outlet level — and that gap is costing you more than you think.
Ishita Shah
Content Editor, FireAI
May 6, 20266 min read
Showing page 1 of 5 (50 total results)
Newsletter
Stay ahead with FireAI
Get the latest on AI analytics, product updates, and data-driven strategies delivered to your inbox.
No spam, ever. Unsubscribe anytime.