
Quick answer
FMCG brands need secondary sales analytics because distributor billing does not equal retail sell-through. Without outlet-level data from DMS feeds, teams cannot see real velocity, scheme effectiveness, or territory gaps. Analytics closes the billing-to-selling blind spot so forecasts, promotions, and field coverage align with what stores actually move.
FMCG revenue plans often rest on primary sales: what left the factory or what the distributor was invoiced. That number tells you shipment health, not whether the last mile moved stock into shoppers' baskets. Secondary sales analytics is the practice of measuring and acting on what distributors and retailers report as actual offtake, stock, and outlet-level movement so strategy matches ground reality.
This page explains why that distinction matters for Indian FMCG brands today, separate from step-by-step dashboard builds (see forthcoming how-to content in the same cluster). For commercial workflows, see FMCG sales use cases.
The billing vs selling gap: why primary data alone misleads
Primary billing can look strong while shelves sit full or promotions fail to clear. Distributors may load inventory ahead of targets, or pull forward volume to hit incentives, which inflates near-term revenue without reflecting sustainable pull. Planning on invoices alone risks over-production, mis-timed schemes, and field teams chasing the wrong problem.
Why secondary analytics fixes it: When sell-in from billing is paired with sell-out or stockist and retailer-level movement from distributor management systems (DMS), ERP feeds, and beat data, leadership sees whether demand is real or buffered. That is the core reason brands invest in secondary sales analytics: one stream optimizes the supply chain; the other optimizes the market.
Outlet-level visibility: you cannot improve what you cannot see
Modern trade and general trade in India span lakhs of points of sale with uneven coverage and data quality. Without aggregation to outlet, beat, and chain, national averages hide weak pockets, phantom coverage, and outlets that have not reordered in weeks.
Why secondary analytics fixes it: Secondary feeds mapped to outlet hierarchy show numeric distribution, active outlets, drop sizes, and frequency of purchase. Teams prioritise coverage, replenish where velocity warrants rerouting of stock, and stop treating "national secondary up 4%" as success when half the territory flatlined. For how outlet metrics fit broader retail analytics, see outlet-level analytics.
Scheme and trade promotion effectiveness: did the spend move needles?
Trade schemes, price offs, and display investments are large line items. Sell-in spikes after a scheme launch do not prove the promotion cleared at retail or built habit. Without downstream measurement, finance and sales argue with anecdotes.
Why secondary analytics fixes it: Comparing pre- and post-period secondary velocity by region, SKU, and outlet class shows incremental offtake versus baseline. That ties spend to sell-through instead of to dispatch alone. For a definitional companion, read what trade promotion analytics is.
Territory and field force performance: align beats with real demand
Sales managers need to judge whether territories underperform because of distribution, competition, or field effort. Primary targets measure dispatch; they do not isolate whether coverage quality or outlet productivity drove the result.
Why secondary analytics fixes it: Secondary metrics by territory and beat (numeric distribution, strike rate, average drop size, lines per bill when available) show where field programs should intensify versus where supply or assortment is the constraint. This complements field force analytics by grounding incentives and reviews in offtake reality, not only visit counts.
How FireAI supports secondary sales analytics
Most FMCG organisations already generate secondary data in DMS, stockist systems, and mobility apps, but the bottleneck is timely, comparable views for sales, supply, and marketing. FireAI connects these sources so users can ask questions in plain language, build territory and outlet dashboards without heavy SQL, and keep metrics current as feeds refresh. That reduces weeks of spreadsheet merges when leadership asks which regions truly absorbed last month's scheme or which SKUs risk stock-out despite healthy billing.
Better secondary visibility also feeds demand forecasting and production plans, because forecasts based only on primary shipments amplify phantom demand when channel inventory builds.
When secondary sales analytics should be a priority
- National secondary growth masks stagnant or declining outlet productivity in key regions.
- Trade spend is rising but incremental retail offtake is unclear.
- Supply and production teams escalate "why did we miss forecast?" debates without a shared secondary baseline.
- Field incentives are tied to primary or visit metrics alone and behaviour does not match store-level outcomes.
If several points apply, secondary sales analytics is less optional reporting and more how you protect margin and spend in India's competitive FMCG environment.
Ready to act on your data?
See how teams use FireAI to ask in plain language and get analytics they can trust.
Explore FireAI workflows
Go from this topic into product features and solution paths that match what you read here.
Topic hub
BI Fundamentals
Foundational guides on business intelligence, analytics architecture, self-service BI, and core data concepts.
Explore hubFrequently asked questions
Related in this topic
What Is Trade Promotion Analytics? FMCG Schemes & ROI
Trade promotion analytics measures how discounts, display fees, and trade schemes perform against spend and targets. Learn promotion types, ROI methods, and how FireAI tracks scheme performance from DMS and outlet data for Indian FMCG teams.
What Is Field Force Analytics in FMCG? Metrics & Meaning
Field force analytics in FMCG measures how sales teams perform in the field: visits, outlet coverage, orders per call, and productivity. Learn the core metrics and how FireAI builds dashboards from DMS and CRM data.
Outlet-Level Analytics: Know Which Stores Grow and Which Drain Your Revenue
When all outlets look the same in aggregate, you are blind to where the problem is. Outlet-level analytics benchmarks every store, surfaces underperformers by territory, and shows exactly where to act.
What is Demand Forecasting? Methods and AI Techniques
Demand forecasting uses historical sales data and statistical or AI models to predict future product demand. Learn the key methods — time series, causal, and machine learning — and how tools like FireAI automate demand planning directly from Tally and DMS data.
From the blog
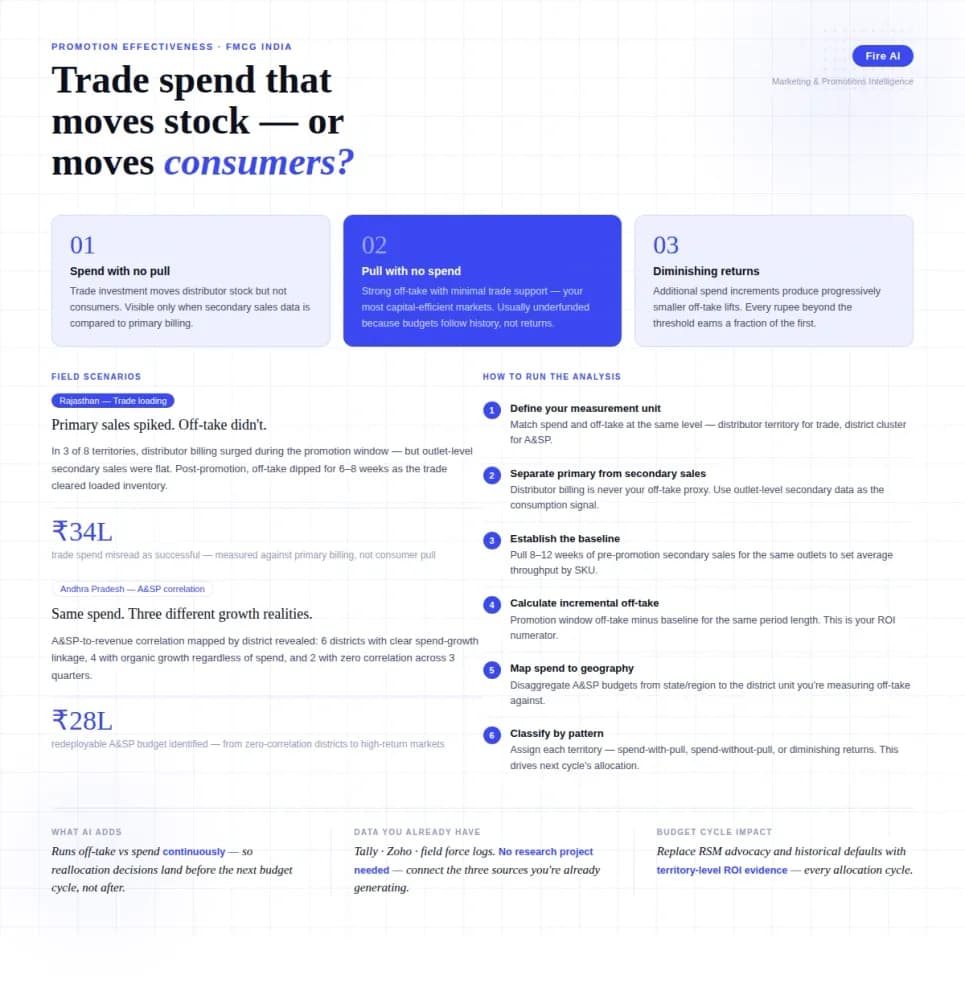
Measuring Promotion Effectiveness: A Data-Driven Guide for FMCG Marketers
FMCG brands in India spend 15–25% of gross revenue on trade promotions and A&SP (advertising and sales promotion) every year. Most can tell you how much they spent. Very few can tell you what it returned. The problem isn't a lack of data — it's that the data lives in disconnected places. Trade spend sits in finance. Off-take data lives with the distributor or field team. A&SP budgets are tracked in a marketing spreadsheet. No single view ties promotional investment to consumer pull at the outlet level. The result is a budget cycle where last year's spend allocation becomes next year's default, because no one has the numbers to argue for something different. This guide walks through how FMCG marketing and trade teams can build a promotion effectiveness framework that actually connects spend to outcome — not just channel-level assumptions.
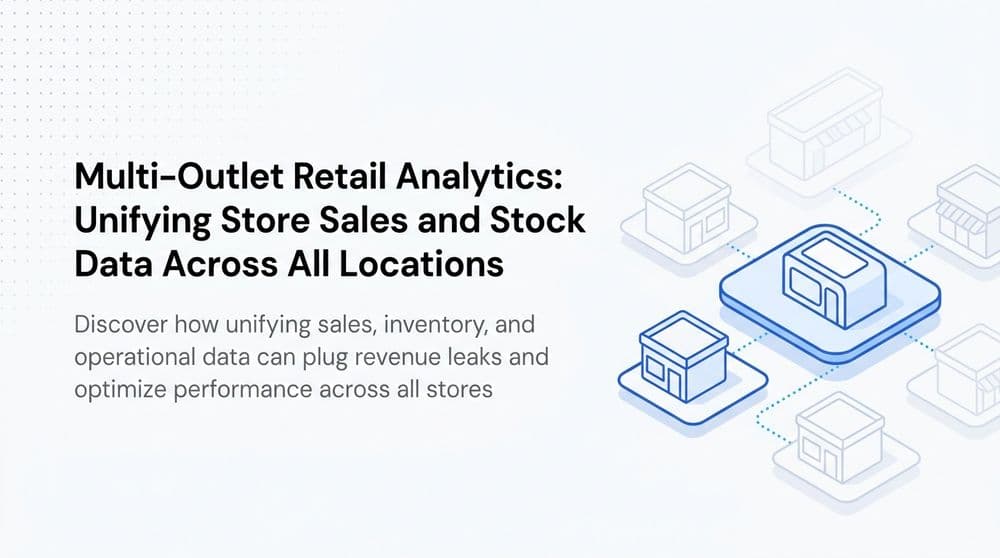
Multi-Outlet Retail Analytics: Track Store Sales
Track sales, stockouts, and staff performance across all stores. Learn how multi-outlet retail analytics can find the root cause of revenue leaks.
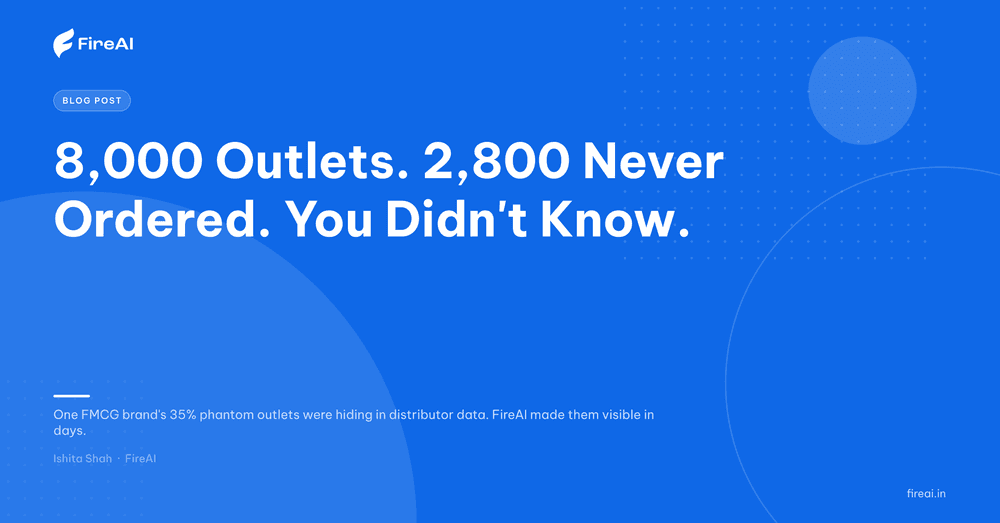
Secondary Sales Tracking: From Excel Chaos to Real-Time Outlet Intelligence
You have primary billing data. You have distributor stock reports. What you don't have is a clear, current picture of what's actually selling at the outlet level — and that gap is costing you more than you think.