

Quick answer
Data-driven decision making (DDDM) means basing business decisions on evidence from data rather than on intuition or habit. It involves defining the question, collecting the right data, analysing it, understanding why the numbers moved, acting, and measuring the result. The step most companies skip is the why.
Ask any Indian founder whether their company is data-driven and the answer is usually yes. They have Tally reports, an Excel MIS every Monday and maybe a Power BI dashboard. Then ask how the last big decision was made: the price increase, the new distributor, the scheme cut. Most of the time the honest answer is a meeting, a few charts and a gut call.
Having data is not the same as deciding with it. The same gap shows up with AI: in McKinsey's 2026 State of AI survey, nearly nine in ten organisations said they use AI regularly, but only 37% could attribute any EBIT impact to it (McKinsey). Tools alone do not change decisions. This guide explains what data-driven decision making really involves, how to do it step by step, and why the "why" behind a number matters more than the number itself.
What is data-driven decision making?
Data-driven decision making is a process where decisions are made on the basis of analysed, verifiable data. It contrasts with decisions based on experience alone, the loudest voice in the room, or "what we did last year".
It does not mean ignoring experience. A good sales head's instinct is valuable. DDDM means that instinct gets tested against evidence before money is spent.
Why is data-driven decision making important?
- Fewer expensive mistakes. Testing a hunch against data before acting catches wrong assumptions early, such as blaming a sales drop on the sales team when a stock-out caused it.
- Faster decisions. When the numbers are ready and trusted, meetings spend time on the choice, not on arguing whose spreadsheet is right.
- Accountability. Every decision has a measurable goal, so you can tell later whether it worked.
- Better resource allocation. Marketing budgets, trade schemes and hiring go where the data shows returns, not where the pressure is highest.
- Early warning. Tracking the right leading indicators shows a problem weeks before it reaches the P&L.
The gap: most companies know what happened, not why
Analytics has four levels:
| Level | Question it answers | Typical tool |
|---|---|---|
| Descriptive | What happened? | Reports, dashboards |
| Diagnostic | Why did it happen? | Drill-downs, root cause analysis |
| Predictive | What will happen? | Forecasting models |
| Prescriptive | What should we do? | Scenario and optimisation tools |
Most Indian businesses stop at the first level. The dashboard says collections are down 18% in Maharashtra. Everyone agrees that is bad. Then the meeting guesses at the reason, and the decision is based on the guess.
This is the real gap in data-driven decision making. A number without a cause is just a better-informed guess. If you do not know whether collections fell because of three large distributors, a new credit policy or a billing error, you cannot pick the right fix. We cover this in more depth in the data decision-making gap.
6 steps in data-driven decision making
Together these six steps form a simple decision intelligence framework: question, metrics, data, what happened, why it happened, and action.
1. Define the decision and the question
Start with the decision, not the data. "Should we extend credit terms for tier-2 distributors?" is a decision. "Show me distributor data" is not. Write down what evidence would change your mind before you look.
2. Pick the metrics that answer it
Choose 3 to 5 measures that relate directly to the decision, such as DSO, order frequency and bad-debt rate. Agree on the definitions first so finance and sales use the same numbers. Our KPI dashboard guide helps here.
3. Collect and clean the data
Pull from the source systems (Tally, ERP, CRM, distributor management system), not from forwarded Excel files. Fix duplicates and mismatched names. Poor data quality is the most common reason DDDM fails.
4. Analyse what happened
Look at trends, compare with targets and past periods, and break the numbers down by region, product and customer.
5. Find out why it happened
Separate the drivers from the noise. Did sales fall because of fewer outlets, a lower average order or a price change? Did the drop start with one SKU or everywhere at once? KPI root cause analysis, whether done by an analyst or by a root cause analysis tool like FireAI's Causal Chain, turns a descriptive number into an explanation you can act on. Why did revenue drop? Analytics that stops at the dashboard cannot say; this step can.
6. Decide, act and measure
Make the call, set a target, and track the same metrics afterwards. Review in 30 or 60 days. This closes the loop and builds trust in the process.
A worked example (illustrative)
A consumer goods company sees collections in Maharashtra fall 18% in a quarter. The first reaction in the review meeting is to tighten credit for every distributor in the state.
Following the six steps changes the decision. The question becomes: "Is the drop broad-based or concentrated?" The metrics are overdue amount, DSO and number of distributors past 60 days. The analysis shows that 70% of the increase in overdue amount sits with four distributors, three of whom moved to a new billing cycle after a system change. The fix is to correct the billing cycle and follow up with one genuinely slow payer, not to squeeze credit for 120 distributors who pay on time.
The data was the same in both cases. The difference was asking why before deciding.
Examples of data-driven decision making in Indian businesses
- Pharma distribution. Daffoworth Pharmaceuticals had sales, returns and collections data spread across tools and made decisions on assumptions. After consolidating into role-based FireAI dashboards with region-wise ROI and expiry-risk tracking, it recorded 10.76% quarter-on-quarter net sales growth and 22.6% lower sales-return losses (case study).
- Logistics. ISA Logistics connected Tally directly to its dashboards, cut manual reporting effort by 60 to 70% and brought shipment tracking from hours to minutes (case study).
- D2C returns. A brand saw returns rising and assumed a product quality issue. Driver analysis showed the increase was concentrated in one courier partner. The fix was a logistics change, not a product recall.
- FMCG trade schemes. Comparing secondary sales in outlets with and without a scheme, while controlling for season, shows whether the scheme created demand or just pulled it forward.
Common barriers and how to fix them
| Barrier | What it looks like | Fix |
|---|---|---|
| Data silos | Sales in the DMS, finance in Tally, marketing in Meta Ads | Connect sources into one platform instead of emailing exports |
| Slow answers | Every new question waits days for the MIS team | Self-service tools with natural language queries |
| Distrust in numbers | Two reports show two different sales figures | One agreed definition per metric |
| No why | Dashboards show changes but not causes | Root cause and driver analysis |
| Culture | Leaders decide first, then look for supporting data | Leaders ask "what does the data say?" before sharing their view |
Culture is the hardest barrier. It changes when leaders model the behaviour. See building a data-driven culture for practical steps.
How AI helps data-driven decision making
Decision intelligence tools remove two of the biggest delays. First, AI-powered BI lets any manager ask a question in plain language and get an answer in seconds. Second, causal AI explains why a metric moved, so the conversation moves from "what happened" to "what do we do".
FireAI is a causal decision intelligence platform built by Steeplogic Systems in India. It connects to 700+ sources including Tally and ERPs, answers questions in 90+ languages, and traces every change back to its drivers. Book a demo to try it on your data.
Related reading
- AI in business intelligence: from dashboards to causal answers
- AI in business analytics: use cases and worked examples
- Executive dashboard KPIs and templates
Sources
- McKinsey, The State of AI (2026)
- FireAI case studies: Daffoworth Pharmaceuticals, ISA Logistics
Ready to act on your data?
See how teams use FireAI to ask in plain language and get analytics they can trust.
Explore FireAI workflows
Go from this topic into product features and solution paths that match what you read here.
Topic hub
BI Fundamentals
Foundational guides on business intelligence, analytics architecture, self-service BI, and core data concepts.
Explore hubFrequently asked questions
What is data-driven decision making in simple words?
It means making business decisions based on facts from your data instead of gut feeling alone, and checking afterwards whether the decision worked.
What are the benefits of data-driven decision making?
Fewer costly mistakes, faster decisions, clearer accountability, better use of budgets, and early warning of problems.
What are the steps of data-driven decision making?
Define the decision, choose the metrics, collect and clean the data, analyse what happened, find out why it happened, then act and measure the result.
What is the biggest challenge in data-driven decision making?
For most companies it is knowing why a number changed. Dashboards show the change but not the cause, so decisions still rely on guesses.
Is data-driven decision making only for large companies?
No. Small and mid-size businesses often benefit more, because each decision is a larger share of their revenue. Modern AI tools remove the need for a data team.
What is the difference between data-driven and data-informed decisions?
Data-driven decisions follow the data closely. Data-informed decisions treat data as one strong input alongside experience and context. Most good leaders work somewhere between the two.
How can I tell if my company makes data-driven decisions?
Look at your last five big decisions. For each one, check whether a metric was agreed before the decision, whether the cause of the problem was confirmed with data, and whether anyone reviewed the result 30 to 60 days later. If most answers are no, the company has data but is not yet deciding with it.
Related in this topic
Why Is Data Quality Important for Analytics?
Discover why data quality is crucial for effective analytics. Learn about accurate insights, reliable decisions, cost reduction, and how poor data quality undermines business intelligence and decision-making processes.
Why Is Natural Language Querying the Future of BI?
Learn why natural language querying represents the future of BI. See the business benefits, practical examples and key considerations.
Why Is Multilingual Analytics Important?
Discover why multilingual analytics is crucial for global businesses. Learn about accessibility advantages, cultural relevance, market expansion benefits, and how regional language support drives better business intelligence and customer insights.
Why Adopt Self-Service BI? Benefits and ROI
Businesses should adopt self-service BI to democratize data access, reduce IT dependency, and accelerate decision-making. Learn why self-service BI matters, which benefits drive ROI, and how it empowers business users with direct analytical capabilities.
From the blog

Closing the Data Decision-Making Gap in Indian Business
Learn how the data decision-making gap stalls growth in Indian enterprises and how causal decision intelligence bridges the analytics gap for teams.
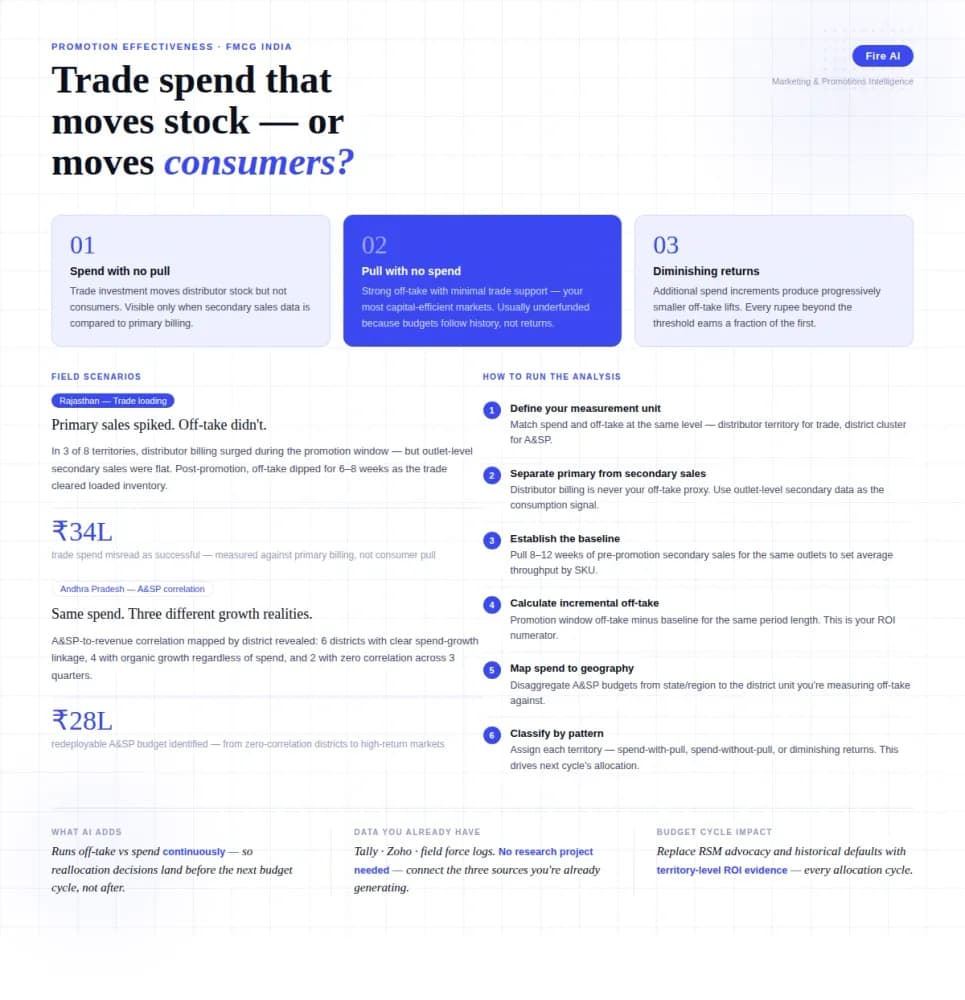
Measuring Promotion Effectiveness: A Data-Driven Guide for FMCG Marketers
FMCG brands in India spend 15–25% of gross revenue on trade promotions and A&SP (advertising and sales promotion) every year. Most can tell you how much they spent. Very few can tell you what it returned. The problem isn't a lack of data — it's that the data lives in disconnected places. Trade spend sits in finance. Off-take data lives with the distributor or field team. A&SP budgets are tracked in a marketing spreadsheet. No single view ties promotional investment to consumer pull at the outlet level. The result is a budget cycle where last year's spend allocation becomes next year's default, because no one has the numbers to argue for something different. This guide walks through how FMCG marketing and trade teams can build a promotion effectiveness framework that actually connects spend to outcome — not just channel-level assumptions.

How a Modern Analytics Platform Transforms Business Intelligence
Why faster decision-making, real-time analytics, and AI-driven intelligence separate market leaders from laggards—and how Fire AI closes the gap between data and action.